GRAPH ANALYSIS
1. X-Direction Wind

Find the maximum wind speed of each and analyze it associated with Sea Breeze. Also, check out the differences of each case by comparing when does the wind speed occurs maximum, and the height of the inflow layer, and distance from the coast at that time.
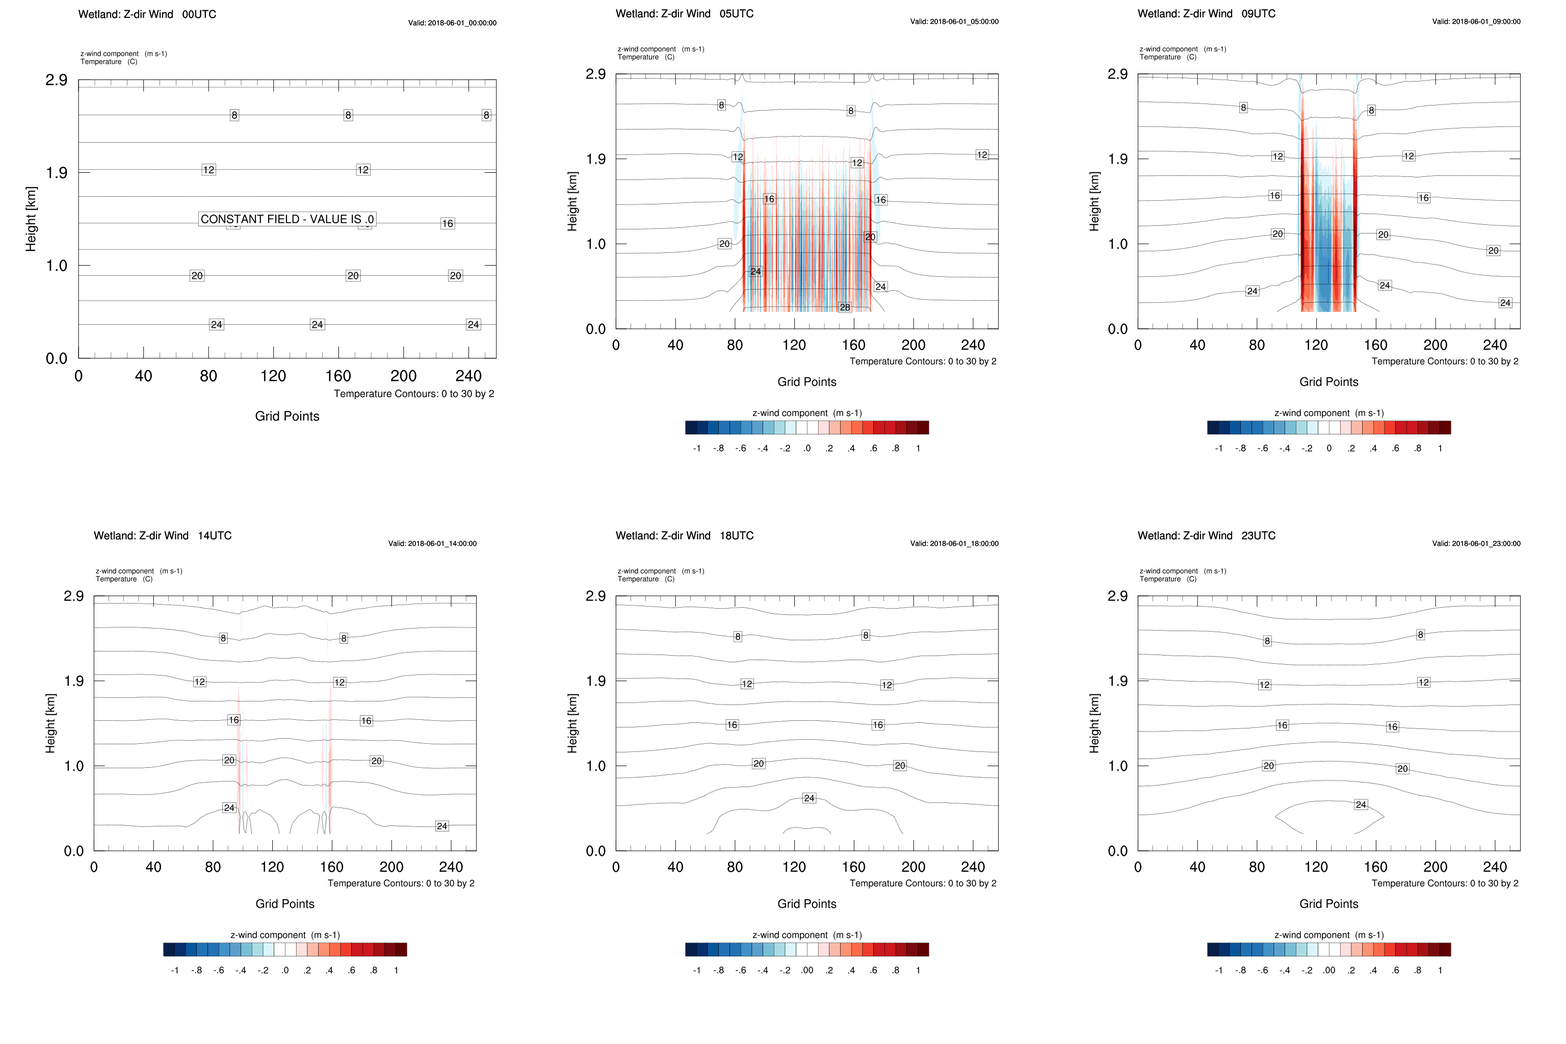
2. Z-Direction Wind
2. Z-Direction Wind & Wind Velocity


Find out the time when is the maximum of z-direction wind velocity. Compare the updraft of z-direction wind with the movement of x-direction wind. Compare the movement of the x-direction wind in the land direction with the time and the updraft of the z-direction wind.
3. Temperature and Wind Vector
![[CR] Temp_Vec_3km.gif](https://static.wixstatic.com/media/22d729_832323f5a15c44a09bd97f1bfc42b847~mv2.gif)
Follow the vectors of wind and check the flows of Sea and Land Breeze. Also check how wind fast and strongly the wind is moving.
4. Wind Velocity Distribution for Each Time

It shows x-direction wind velocity change according to time by grid. In this graph, you can see the Sea Breeze starting from the coast and expanding inland in time. In addition, we can confirm the movement of the inland air parcel with time and, at the coast, the occurrence time of the Land Breeze in the coast.
5. X-Direction Wind Vertical Profile by SFZ0
![[최최종] East_vertprof.png](https://static.wixstatic.com/media/22d729_0a36b1dd02134ccf94b21edf2ca8b8ca~mv2.png/v1/fill/w_380,h_336,al_c,q_85,usm_0.66_1.00_0.01,enc_avif,quality_auto/%5B%EC%B5%9C%EC%B5%9C%EC%A2%85%5D%20East_vertprof.png)
12 KST is the starting point for the Sea Breeze, and 21 KST is the time when the Sea Breeze is turned into a Land Breeze due to the radiation cooling of the land. Therefore, the intensity of the wind in the x direction in the two time zones is also weak. Well-developed Sea Breezes are remarkable at 15 KST and 18 KST, and strong westerly wind inflow is observed up to 1km.
Therefore, the wind intensity profile according to the Roughness Length difference can be well observed through 15 KST and 18 KST.
6. X-Direction Wind Timeseries by SFZ0
![[최종] timeseries_SFZ0.png](https://static.wixstatic.com/media/22d729_8fcea7fc9c4a48009a5792a4ceffc494~mv2.png/v1/fill/w_349,h_336,al_c,q_85,usm_0.66_1.00_0.01,enc_avif,quality_auto/%5B%EC%B5%9C%EC%A2%85%5D%20timeseries_SFZ0.png)
Determine how the wind intensity varies in each region according to the Roughness Length. Check the intensity and duration of the Sea and Land Breeze depending on the location of the weather station.
7. X-Direction Wind Timeseries by
LANDUSE Index & Correlation of
U 10 : Observation and Model


Compare “the U10 data of the model run with the Realistic LANDUSE index” and “the station observed zonal wind velocity” provided by KMA. This will show the accuracy of the WRF 2-dimensional Sea Breeze modeling. We’ll see the accuracy and tendency of the NWP experiment by checking correlation, coefficient, and y-intercept of linear regression between model and observation data.

